


Create and import scatter charts with multiple x-series in Google Sheets
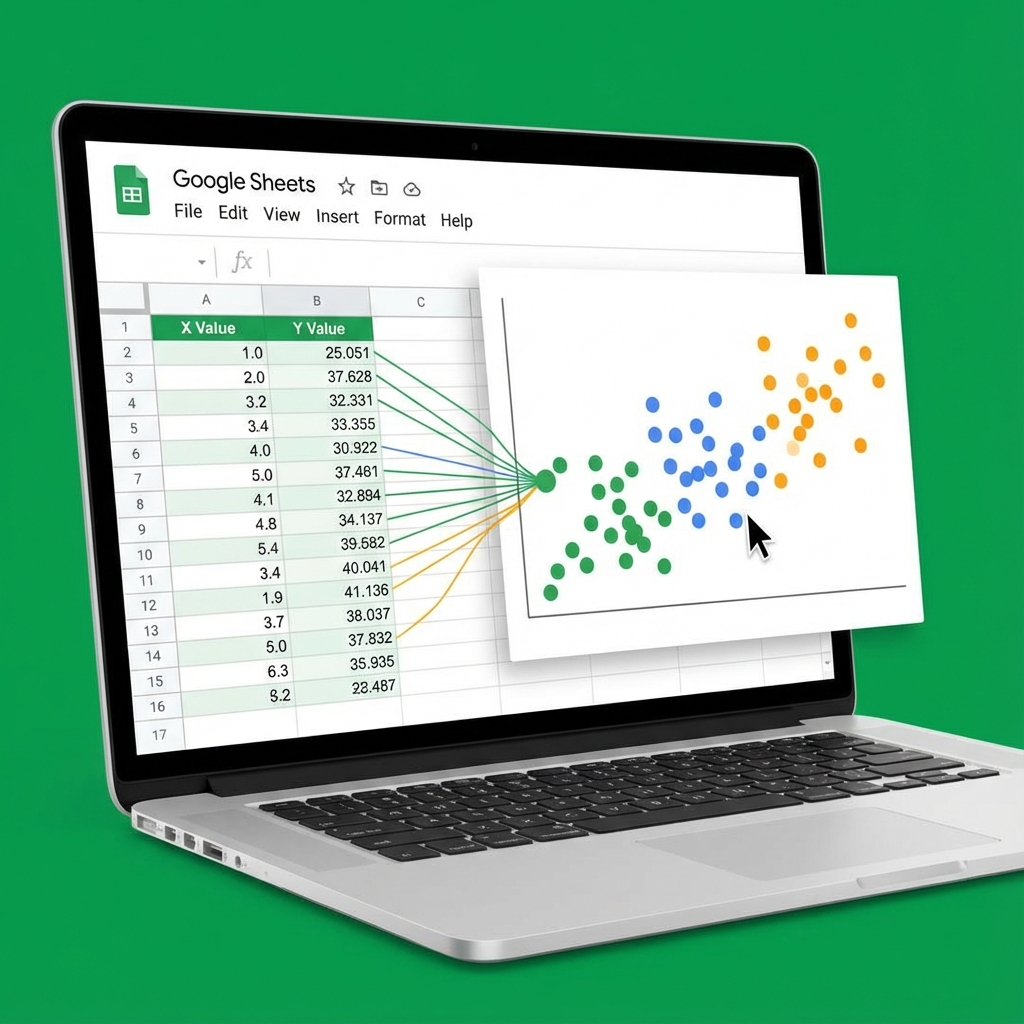
Create and import scatter charts with multiple x-series in Google Sheets
Google Sheets now supports creating and editing scatter charts with multiple independent x-series. This update allows users to map separate data series to their own unique x-axis, rather than forcing all series in a single chart to share the same horizontal axis domain.
Additionally, this feature improves import and export compatibility with Microsoft Excel. Previously, importing Excel files with multiple x-series scatter charts into Google Sheets would drop the extra axes and revert to a single x-axis. Now, these configurations are accurately preserved when moving spreadsheets between platforms.
 |
User creating a scatter chart with multiple x-series in Google Sheets |
Getting started
- Admins: There is no admin control for this feature.
- End users: Visit the Help Center to learn more about adding and editing a chart in Google Sheets.
Rollout pace
- Rapid Release domains: Gradual rollout (up to 15 days for feature visibility) starting on July 29, 2026
- Scheduled Release domains: Gradual rollout (up to 15 days for feature visibility) starting on August 14, 2026
Availability
- Available to all Google Workspace customers and users with personal Google accounts
Resources
- Google Docs Editors Help: Add & edit a chart or graph
Create and import

How to Create a Scatter Chart with Multiple X-Series
-
Structure Your Data
Set up your spreadsheet columns clearly. For two independent series, create four columns:
-
Column A: Series 1 X-values
- Column B: Series 1 Y-values
- Column C: Series 2 X-values
- Column D: Series 2 Y-values [2, 3]
-
-
Insert the Chart
- Highlight all four data columns including your header row.
- Click Insert > Chart from the top menu. [4, 5]
-
Configure Multiple X-Axes
- In the Chart Editor panel on the right, switch the Chart type to Scatter chart.
- Look under the Setup tab.
- Google Sheets allows you to add multiple independent ranges for your X-axis. Click on X-Axis and add both Column A and Column C as your horizontal metrics.
- Under the Series section, map Column B as the Y-axis for Series 1 and Column D as the Y-axis for Series 2. [4, 5, 6]
-
Customize the Visuals
- Switch to the Customize tab in the Chart Editor.
- Select Series to assign unique point colors, shapes, and sizes to differentiate your datasets.
- Expand Chart & axis titles to clarify what each independent horizontal line represents. [2, 5, 7]
Importing from Microsoft Excel
.xlsx file into Google Sheets would drop any additional X-axes and flatten the chart into a single horizontal domain. [1] - Automatic Preservation: Now, when you Import or Open an Excel workbook containing multiple X-series scatter plots, Google Sheets automatically converts and preserves the exact multi-axis framework. [1]
- Bidirectional Compatibility: If you export your Google Sheets document back into an Excel format (
.xlsx), the multiple X-series chart configuration remains perfectly intact for Excel users. [1]
Alternative Method: The Single-Column “Staggered” Layout
- Column A (All X-values): Combine all X-values into one column. [3, 8]
- Column B (Series 1 Y-values): Place Y-values next to Series 1 X-values; leave rows for Series 2 blank. [3]
- Column C (Series 2 Y-values): Leave rows for Series 1 blank; place Y-values next to Series 2 X-values. [3]
Create and import
Read more
. How Autonomous AI Is Transforming Chip and System Design
. 13 Google tips for a fun, productive summer off from college
. Switch to Android easily and bring your data with you.
. Google’s Illyes Unsure On Shifting unavailable_after Dates
. Streamline collaboration in Google Docs with Gemini-powered comment workflows
. What Exactly Is USB-C? (The Real Reason Apple Lost)
. Generate and edit visuals with Gemini in Google Docs570. 3 Google updates from Galaxy Unpacked 2026
. Here’s how to ask Gemini Live for help with anything you see.
. Q2 2026 earnings call: Remarks from our CEO
. Introducing selfie for sign-in: a new, easy way to access your Google Account
. Updated options to better view Google Calendar on large monitors
for more refer Gemini website click here
for more refer Artificial Intelligence website click here